 1 and 2 with the vertical. The students verify that the sum of
forces in the horizontal and vertical directions vanishes.
1 and 2 with the vertical. The students verify that the sum of
forces in the horizontal and vertical directions vanishes.
The City College of New York, School of Engineering has introduced an ECSEL-sponsored two-course sequence of engineering design courses which are required of all freshmen engineering students. The courses are intended to stimulate the students' interest in math, science and engineering and give them a hands-on experience of what the chemical, civil, electrical, and mechanical engineering disciplines are all about. All investigations and design projects are performed in groups and presented by the students orally before their peers, instructors and other faculty members. Students enrolled in these courses are quite enthusiastic and often stay after hours in the lab preparing and fine-tuning their projects. A study comparing students exposed to the ECSEL freshrnan design courses with those who were not shows a significant improvement in the retention rate of ECSEL students, especially for minority students. One of these courses is also being offered to students from A. Philip Randolph High School and an effort is underway to introduce these courses into the CUNY Community Colleges as well.
As part of the ECSEL "Learning by Design" effort at CCNY over the last seven years, the School of Engineering has introduced a two-course sequence of engineering design courses which are taken by all freshmen engineering students. Engr 101 - Engineering Design Workshop I has become a required course in all Engineering Departments of The City College. In addition, the Departments of Chemical, Civil and Mechanical Engineering also require their students to complete Engr 102 - Engineering Design Workshop II. In place of Engr 102, the Department of Electrical Engineering requires its students to complete Engr 103 Computer Aided Analysis for Electrical Engineers which places a greater emphasis on mathematics needed for electrical engineering applications.
The content of the Engr 101/102 design courses currently consists of four half-semester modules dealing with (1) structural design, (2) robotics, (3) electronic circuit design and (4) chemical distillation. Each of the modules will now be described in detail.
The Structural Design Module
In the structural design module, the behavior of materials and structural members are explored. The students are asked to perform four preliminary experiments. The first experiment is designed to illustrate the relationship between tension load and elongation. The experiment is done using rubber tubes which exaggerates the change in length and cross sectional area Weights are suspended at the end of a one-foot long tube, a two-foot long tube and two one-foot long tubes connected in parallel. The students plot a curve showing the relationship between the applied load and the measured deformation and the applied stress (force per unit area) versus the strain (deformation per unit length) for the experiments performed above. The second experiment deals with types of failure of a structural member under compression. In the first part of the experiment, the students apply a five pound weight on a circular piece of sponge and observe how it crushes under the applied load. In the second part of the experiment, the students place a plastic ruler on a scale and press down on the ruler until it bows out of plane while noting the load that caused buckling. The experiment is repeated for three different length rulers. The students plot a curve giving the load at which buckling occurs versus length. The third experiment demonstrates bending in beams. A wooden beam is placed horizontally between two supports with the wider side of the cross section resting on the supports and loaded in the middle in two-pound increments while the deformation is measured for every load step. The experiment is repeated with the shorter side of the cross section resting on the supports. The students plot load versus deformation for the two cases studied. The fourth experiment deals with fatigue failure. A paper clip is straightened out and then bent back and forth repeatedly about 30 degrees until it breaks in two. The students prepare a histogram of the number of clips that broke versus the number of cycles needed to break them.
Concepts of structural safety and equilibrium are also developed in this module. Students
perform
three related experiments. The first experiment demonstrates the effects of the magnitude and
location of a force on the equilibrium of structural members. A beam is placed over a scale such that
the middle of the beam falls on the center of the supporting scale. A one-pound weight is placed at
each end of the beam. As the weight on the right side of the scale is moved to half the distance
between the end of the beam and the scale, the beam becomes unbalanced and falls down. Students
are asked to determine how many weights should be placed at that point in order to keep the beam in
equilibrium and to determine a relationship between the number of weights and the distance needed
to keep the beam in equilibrium. The second experiment deals with end reactions of a loaded beam.
A weight P is placed at the center of a beam supported at its ends by two scales. The weight is then
moved to the left a certain distance and the distance from the weight to each of the scales, a and b are
measured. The students verify that for every load position recorded, the reading on the left scale is
Pa/(a+b) while that on the right is Pb/(a+b). The third experiment illustrates how internal forces
develop in a simple truss structure. A weight is suspended by two wires which are attached to spring
balances. The wires make an angle 1 and 2 with the vertical. The students verify that the sum of
forces in the horizontal and vertical directions vanishes.
The students are then introduced to the structural analysis software SAP90 which is commercially available from Computers and Structures, Inc., Berkley, CA. They become acquainted with the software by analyzing a simple three member steel truss containing members of various cross sectional areas and subjected to two different loading conditions. The required input to the program consists of the number of loading conditions, types of restraints at each of the joints, the coordinates of each of the joints, information pertaining to the truss members and loadings. The software then calculates the internal member forces, the reaction forces, and the displacement of each joint. The students check the results to verify that no errors were committed during input data preparation or in the interpretation of the results by verifying that equilibrium at each joint and for the whole structure is maintained.
These concepts are then applied to the analysis of a steel truss bridge that spans a total distance of 63 feet. The truss bridge consists of two planar parallel trusses. The lower chords of the trusses support the roadway which in turn carries the car and truck traffic. The object of this analysis is to calculate the internal forces in each member of the bridge under the effect of the weight of the bridge and roadway (dead load) and the weight of the vehicles that are likely to cross the bridge (live loads). It is herein assumed that the bridge carries two lanes of vehicular traffic. Students are asked to make a first estimate of the internal forces in each truss member under regular truck traffic. Initially, a uniform area is assumed for each structural member and the structural analysis is performed using the SAP90 package described previously. The students use MS-EXCEL to find the area of steel required for each member to carry the forces applied on it. The new estimates of member weights and member areas are then inputted back into the SAP90 program and the structural calculations are repeated until convergence is achieved. Finally a cost analysis is done of the material (concrete and steel) needed to build the bridge.
As a final step of this module, students are required to build a model of the bridge that they have designed using tongue depressors as the truss members and small bolts and nuts to connect them. The area of each truss member is controlled by using two or more tongue depressors in parallel. The number of tongue depressors used in the construction of the model serves as a measure of efficiency of the design. Finally each model is tested and judged by loading it to the point of failure.
The Robot Design Module
The second module focuses on basic mechanisms, kinematics, feedback and computer control by considering the operation of several robotic devices. The module begins with a demonstration of a SCORBOT ER-V+ robot. Students study each of its motions and determine whether it is translational or rotational. They draw a sketch showing the entire mechanism, identify each joint in the sketch and count the number of degrees of freedom permitted by each. A similar analysis is then done on the human arm. Students discuss the ways the two systems are alike and differ. They are asked to describe some tasks which would be best performed by the robot and others which would be more appropriate for humans and to describe the advantages and disadvantages of each system in each case.
An introduction to robot kinematics is provided with a robot simulator consisting of two links.
The
lower end of the first Link is fastened to a horizontal surface such that its azimuthal angle and its
elevation angle  1 may be varied. A second link is attached at the
upper end of the first one with a
pin joint such that its elevation angle 2 may be varied. The point
of attachment of the lower link to
the horizontal surface serves as the origin of a Cartesian coordinate system. The students adjust the
simulator so that its tip reaches a point which is not near any of the coordinate axes. They measure
its angular and Cartesian coordinates using a ruler, triangle, goniometer and level. Using a
spreadsheet or pocket calculator, they find the theoretical Cartesian coordinates of this point. The
exercise is repeated for at least one additional point and a table is prepared, using MS-EXCEL,
showing measured and calculated values of the Cartesian coordinates of each point and the
percentage error in each case. Furthermore, students are asked to analyze and discuss possible
sources of error.
1 may be varied. A second link is attached at the
upper end of the first one with a
pin joint such that its elevation angle 2 may be varied. The point
of attachment of the lower link to
the horizontal surface serves as the origin of a Cartesian coordinate system. The students adjust the
simulator so that its tip reaches a point which is not near any of the coordinate axes. They measure
its angular and Cartesian coordinates using a ruler, triangle, goniometer and level. Using a
spreadsheet or pocket calculator, they find the theoretical Cartesian coordinates of this point. The
exercise is repeated for at least one additional point and a table is prepared, using MS-EXCEL,
showing measured and calculated values of the Cartesian coordinates of each point and the
percentage error in each case. Furthermore, students are asked to analyze and discuss possible
sources of error.
In the next task, the students determine the work envelope of the robot simulator, i.e. the surface
consisting of all the points which are accessible by the tip of the simulator. To simpLify the task, two
special cases are considered. In the first case, both links are constrained to lie along the same line but
the elevation and azimuthal angles of this straight Line are permitted to change freely (1 = 2). In
the second case, the lower link is constrained to lie in the horizontal plane (1 = 0) but the azimuth
angle and the second elevation angle 2
are permitted to change freely. Students are asked to
sketch these surfaces using principal and oblique views, transfer them to transparency films, and
present them to the class via overhead projector. For each of the surfaces generated (a hemisphere
and a torus) the students must derive the equation for the surface and implement this equation in
MATLAB to obtain a graphical display of the surface.
Students then engage in a robotic design project which may include software or hardware design or both. Each group uses a Fischertechnik Automated Vehicle or Fischertechnik Robotic Arm which is controlled by an IBM compatible PC using a GWBASIC program. The students must design and test software for controlling one of the robotic devices listed above. As in any design project, the first steps are to gather information about the materials and systems available and to formulate the problem which the design will attempt to solve. Students are given detailed exposure to the device they will be programming, the space within which it operates and the kinds of actions it can perform. They investigate how each of the axes of the robot is controlled. They are asked to find the motion, or input drive system for each axis, identify the load which is driven by this motor and explain with sketches how the power is transmitted from input to output. By the end of the session, each student has a good feeling of how the robot can move around and how the sensors keep track of its location in the work space. Each group is then asked to develop a task which they would like to program the robot to perform. Students spend the remaining sessions programming the robot to perform this task.
Digital Clock Design Module
The third module begins with an introduction to number systems and binary codes. The students perform three exercises. In the first exercise, students use three blocks having the shape of a triangle, a square and a circle to design a number system which allows one to express any whole number from 0 to 26 using no more than three symbols for each number. The second exercise deals with binary representation of decimal numbers. One member of the group selects a number between 1 and 100. The rest of the group then tries to determine the number by asking a series of "yes" or "no" questions. Students are asked to develop a strategy for determining the number using as few questions as possible. The third exercise deals with binary addition and subtraction. Students prepare a list of all the 4-bit binary numbers, together with their decimal equivalents. Then they make up some addition and subtraction examples using binary numbers exclusively. They perform the operations using the same rules as in the decimal system for carrying and borrowing. They then convert each problem back to decimal, including the answer, and check to see if it came out right. For homework, students are asked design a grid of dots or lines for representing alphanumeric characters. They are asked to compare their design with one found on a commercial device, such as a pocket calculator, and to point out the advantages and disadvantages of their design.
In the next part of the module, students are given an introduction to integrated circuits. They explore the properties of a CD4518 counter chip by setting up a simple oscillator circuit and monitoring the input and four output signals of the device (designated Q0, Ql, Q2 and Q3) with an oscilloscope. The students then prepare a timing diagram and counting sequence of the device and observe the frequency relation between the input and output signals. In the next exercise, the students are asked to design a decoder which will translate a 4-bit binary code into a 7-bit code such that the output from the counter may be used as input to a 7-segment light emitting diode (LED) display. The students prepare a truth table or translation scheme which this binary to seven-segment decoder should perform. They are then introduced to the CD4543 chip which performs this function and are asked to connect this decoder device from the four output terminals of the counter to the seven input terminals of the LED display. When the circuit is powered, the students discover that the display appears stuck on one number. They discover that the clock frequency, which is 1000 cycles per second, is much faster than the eye can follow and realize the need to slow the clock down, which is the function of the pre-scaler circuits. They are told that a prescaler is nothing but a counter which is set up to reduce clock frequency by running it through from the clock input to the Q3 output. The students then experiment with prescaler circuits and find the best pre-scaler output to be used for constructing the "second hand" of a digital clock. The final ingredient needed in the design of a digital clock is the concept of modulo counters. When a counter has reached a prescribed limit, or modulus, it is desirable to reset all of the outputs to zero. This is accomplished by activating the Master Reset (MR) input to the counter long enough to reset iL A device which does this is the CD4028 decoder. The students connect the CD4518 counter outputs to the CD4028 decoder inputs and use one of the decoder outputs to operate the MR line of the counter. The display is used to show the counting sequence and students revise the circuit if necessary to obtain the desired modulus. The students are also introduced to another counter chip, the CD4029B which is considerably more flexible than the CD4518. It can be operated either as an "up" or "down" counter, depending on the state of the UP/DN input; it can be operated as either a decimal (mod 10) or hexadecimal (mod 16) counter, depending on the state of its BIN/DEC input; and it has parallel load capability, i.e. it can be set to any binary number in its counting sequence by setting up the desired codes at four of its input terminals. Students experiment with the CD4029B Up/Down counter and the CD4028 decoder to create interesting counting sequences. Students document each of the circuits tried and the counting sequence obtained for each one. The documentation of each circuit consists of a schematic diagram which the students prepare using Idraw or other graphics software.
The final part of the module requires each group to design and build a digital clock. In designing the clock, the students must decide what functions the clock will perform. Will it count up or down? Will it express time in seconds, minutes and hours, or some other units. Will it be a 12-hour clock or a 24-hour clock? Having specified the clock, it is divided into a few main sections or modules: oscillator, pre-scaler, second "hand", minute "hand", hour "hand" (or other units). Then the students design each section in detail. A lot of work and thought is involved here. Students may decide to divide the task among the members of the group, assigning each person responsibility for designing and building a different section. A major element of the design is to plan out how the overall circuit will be divided among circuit boards. For example, all of the seven-segment decoders and the display should be consolidated on a single board; but the binary inputs can be bridged over from one or more separate boards. The design may include special features such as an AM/PM indicator, the capability to set the clock to the current time, an alarm, and/or a moving message display.
Batch Distillation Module
The purpose of this module is to introduce students to distillation, one of the widely used separation technologies used in the chemical processing and petroleum refining industries. Students start by taking data on a flash (Rayleigh) distillation apparatus, then using the data to validate a computer model, and finally extending the concept of distillation to a staged batch distillation design problem using another computer model. The computer models are part of DISTSIM, a suite of models developed by Professor Irven Rinard, Department of Chemical Engineering at CCNY for the dynamic simulation of various types of distillation equipment.
In Experiment 1, the students are given a brief introduction to the concepts of distillation. These include: (1) the development of distillation from its early use to make distilled spirits to its present widespread use in chemical manufacture and petroleum refining, (2) the concept of volatility as the basis for vapor-liquid separations, starting with the concept of a boiling point and extended to vapor pressure, and (3) the operation of a single-stage batch (Rayleigh) distillation unit. The mixture chosen for the subsequent distillation studies is that of acetic acid and water since it is relatively safe for students to handle. This mixture is essentially non-flammable and of low toxicity (vinegar is a dilute solution of acetic acid in water). Since acetic acid is mildly hazardous, the students are introduced to the relevant safety concepts and required to read the Material Safety Data Sheet included in the appendix of the manual. Students are required to wear safety glasses or goggles during all phases of the experimental work and protective gloves when handling acetic acid. To complete this experiment the students use the distillation apparatus (a 500 ml Pyrex flask equipped with a water-cooled glass condenser and a thermometer and heated by an electric heating mantle). This first distillation run uses pure water. The students take data on the time to heat up and the rate at which water is distilled into a beaker (approximately 200 mVhr). At the end of the run, they must do a material balance. Does the amount of water left in the still plus the amount distilled into the beaker equal the amount initially charged to the still?
In Experiment 2. the students are introduced to the two methods of composition analysis to be used for the subsequent flash distillation experiments, namely, hygrometry and refractometry. They use an analytical balance to make up two solutions of different compositions (weight % basis) and then determine the specific gravity and refractive index of each. These values are compared with those obtained from the literature. The students are then introduced to the use of DISTSIM for flash distillation. They use the FlashD routine to simulate the performance of the still for the conditions of the distillation run they will make in Experiment 3.
In Experiment 3, the students make up a solution of acetic acid and water and charge this to the still. They perform a distillation run similar to that in Experiment 1 except that the condensate is collected in a series of samples of about 30 ml each. The composition of each sample is measured using the refractometer. At the end of the run, the still is cooled down and its contents analyzed. The students do both acetic acid and overall material balances. A closure of 3 to 5% has been obtained in preliminary test runs.
In Experiment 4, the data taken in Experiment 3 is compared to the composition versus time data predicted by the DISTSIM program. If reasonable agreement is obtained, the students can proceed to the design problem. If not, the students will make another distillation run, particularly if the material balances from the previous run are poor, and repeat the comparison with the DISTSIM model.
In Experiment 5, the students are introduced to multi-staged separation as a means for improving the separation that can be obtained over that of a single-stage flash distillation. For this they will use BatchD, the multi-staged batch distillation model available in DISTSIM. This routine has been configured with a fixed number of ideal stages and a fixed vapor generation rate. Thus, only two design variables are available, namely, the distillate withdrawal rate D and the cut length to be used for each cut. The students first use the program to obtain some understanding of the effect of the two design variables on the purity and size of a given cut. They are then introduced to the use of slop cuts as a means of improving overall separation efficiency.
In Experiment 6, the students now use BatchD to design an operating policy to process a feed of specified weight percent of acetic acid which maximizes the amount of feed that can be processed annually that meets the purity specification. This must be done by trial-and error. The operating policy to be determined is the number of cuts per cycle (including slopcuts) and the distillate withdrawal rate and cut length to be used for each cut. The team whose policy leads to the largest throughput is the winner of the design competition.
In place of Engr 102, the Department of Electrical Engineering at the CCNY requires its students to complete Engr 103, entitled, "Computer-Aided Analysis for Electrical Engineers." This course introduces students in electrical engineering to computing hardware and software as well as mathematics which will be useful to them in their studies and careers in electrical engineering. The textbook used for the course is, A Firs~ Course in Electrical and Computer Engineering with MATLAB Programs and Experiments, by Louis Scharf and Richard T. Behrens (Addison-Wesley).
The course begins with an introduction to the SUN workstation environment. Students are shown how to use the text editor and some basic UNIX commands. They are then given an introduction to MATLAB. Using this software, they learn about various mathematical functions and their graphs. Concepts covered include linear and quadratic functions, polynomials, trigonometric and exponential functions, finding extreme values of functions, translation, dilatation, reflection, absolute value and the inverse of a function. Students are then introduced to complex numbers. Topics covered include geometry of complex numbers, algebra of complex numbers, inverses, complex conjugates, powers, geometric series, roots of quadratic equations, Euler's identity, the roots of unity and related topics. Students learn about phasor representation of signals, adding phasors, multiphase circuits and constellation of signals. They study the properties of vectors, including addition and subtraction, scalar multiplication, scalar product, Euclidean norm, unit vectors, direction cosines and projections. They learn about the properties of matrices, including addition and subtraction, scalar and matrix multiplication, transposition, the inverse of a square matrix, and the solution of systems of linear algebraic equations. These concepts are applied to circuit analysis and design. In the last part of the course, students learn about transformation of complex numbers, including rotations, scaling, translations and composite transformations. Finally, these concepts are applied to Digital Image Processing also with the use of MATLAB
All investigations and design projects in Engr 101/102 are performed in groups and presented by the students orally before their peers, instructors and other faculty members. This oral report serves as the final examination for the course. The report includes a brief specification of the problem the design is intended to solve, a demonstration showing how effective the design was in actually solving the problem, an outline showing the design concept used to deal with the problem, design details which were particularly challenging to the group, an account of the process the group went through in approaching the problem, including issues in group dynamics, i.e., how members of the group dealt with each other, a discussion of improvements that could be made to the design if more time were available, and the group's evaluation of the product and of the procedures used in developing it. Students may use handouts, the chalkboard, overhead projector and/or other available visual aids in presenting their design. Their presentation is evaluated by outside reviewers, who fill out a form indicating their assessment of the group's performance in these categories. They are also asked to comment on items such as clarity of the presentation, the organization of the presentation and participation of all group members.
Testing for Engr 103 is administered by having the students access an exam file during exarn hours via the UNIX network. The students are required to use MATLAB to solve each problem and send answers directly to the instructor's directory for grading.
Students enrolled in these courses are quite enthusiastic and often stay after hours in the lab preparing and fine-tuning their projects. In an effort to quantify the effectiveness of these courses in improving retention rates in the School of Engineering, a study was conducted in which the retention rates for students enrolled in Engr 101 are compared with engineering students enrolled in Math 75 ("Functions and Graphs" which is a co-requisite for Engr 101). The data is averaged for students enrolled in these courses in the Fall of 1988, 1989, 1990 and 1991 semesters. It should be noted that Engr 101 was introduced as a required course in the Fall 1991 semester. The average number of students per year used for the study is 36 Engr 101 students and 174 Math 75 students. Figure 1 shows a significant improvement in the retention rate for the ECSEL students which occurs during the first year of study and carries through to the remaining years. Retention rates were also obtained for minority students during the same period. The term minority refers to all Native Americans, African Americans, Hispanics and Puerto Ricans. Asians are not included. The average number of minority students per year used in the study was 23 Engr 101 students and 125 Math 75 students. As can be seen from Figure 2, ECSEL had an even greater positive effect on the retention of minority students in engineering.
In closing, we wish to mention that Engr 101 is also being offered to students from A. Philip Randolph High School in an effort to arouse their interest in math, science and engineering. An effort is also underway to introduce these courses in the CUNY Community Colleges as well.
This work was supported by Subgrant A6-34024 from Howard University under NSF EID905318, and Subgrant A6-34066 from Howard University under NSF EEC-9528925. Professor M. Lucius Walker, Jr. of Howard University is the P.I. and Dr. William S. Butcher of NSF is the Program Manager. The authors would like to extend their most sincere gratitude to all colleagues and teaching adjuncts participating in this ECSEL effort on freshman design.
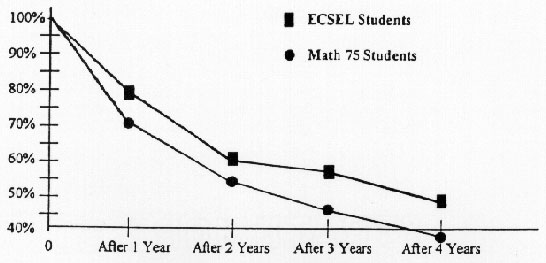
Figure 1. Comparison of average retention rates in engineering for ECSEL students and engineering students enrolled in Math 75. up
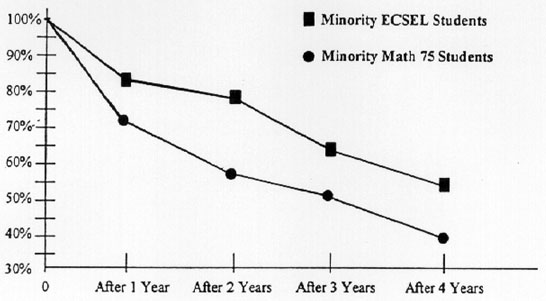
Figure 2. Comparison of average retention rates in engineering for minority ECSEL students (Engr 101) and minority students enrolled in Math 75. up
 Back to Table of
Contents
Back to Table of
Contents