IMPACT OF THE MICROCOMPUTER SPREADSHEET ON
TEACHING OF SOME ENGINEERING COURSES
ABSTRACT
A very few years ago few, if any, students in junior level engineering courses had any prior experience with application of a spreadsheet in engineering calculations. Today, we find introduction to the basic operation of a spreadsheet occurring in freshman level courses, with continued application throughout the engineering curriculum. In the introductory course in the Mechanical Engineering and Energy Processes department (MEEP) at Southern Illinois University at Carbondale, such an introductory course was introduced about two years ago. To satisfy requirements of the course, capability in word processing, spreadsheets, basic statistics, and equation solving software such as TK Solver are required. Thus the foundation is laid to utilize these tools throughout the remainder of the bachelor's degree curriculum, and beyond.
The use of spreadsheets can, in some courses, significantly reduce the time students require for routine calculations on homework. This provides the opportunity to include more course material, without increasing the demand on students time. The use of spreadsheets also forces a student to organize problem solutions in a methodical fashion.
There is increasing emphasis in ABET accreditation criteria to demonstrate an integrated approach to teaching concepts of engineering design throughout the curriculum.
Through the use of spreadsheets, opportunities may be created to provide such design continuity, where spreadsheet solutions created by the students in earlier courses may be built on in subsequent courses. This provides the basis for an integrated design experience for the student. This paper will focus on the use of spreadsheets in an undergraduate engineering curriculum by examining their application in two course areas; engineering economics and thermodynamics.
SPREADSHEET APPLICATIONS IN ECONOMICS AND THERMODYNAMICS
Spreadsheet Applications in Economics:
An example of the application of a spreadsheet to increase the efficiency of covering course material is its use in the Engineering Economics course at SIUC. For many years this has been a two credit hour course. However, given the pressure on engineering education to reduce the total hours required to complete the engineering degree, it was necessary to find places in the curriculum where hours may be cut. Starting next spring semester , an Engineering Economics course of one credit hour will be offered by the Mechanical Engineering and Energy Processes department. It is planned to maintain most of the topics previously covered. This should be possible due to the increased efficiency in covering the material by application of spreadsheet solutions, permitting a restructuring of the course.
Although most modern pocket calculators and spreadsheets have built in functions that provide the ability to readily calculate the time value of money factors used in engineering economics, often they do not permit ready integration of the time value of money equations with the solution of more complex engineering economics problems.
INTRODUCTION
Background During the early years of teaching at SIUC (late 60's, early 70's) the author routinely taught the two credit hour Engineering Economics course. This was a required course for all engineering students. In that pre-calculator (not just pre-microcomputer) period, calculations were performed by slide rule. When pocket calculators first became available, there was a period when they were prohibited from student's use during examinations, in fairness to those students who could not afford this expensive (at that time) calculation aid. However, it did not take long, as prices for pocket calculators dropped dramatically, before their use was not only allowed, but became essential during examinations.
After many years of not teaching the Engineering Economics course, the author resumed teaching this course in 1992. The text used (Collier and Ledbetter, 1988) included a chapter on incremental rate of return, a topic not stressed in the earlier offering of this course. This important concept as applied to evaluation of alternate engineering designs requires an iterative process to obtain the required rates of return and/or incremental rates of return for the alternate engineering solutions being considered for a given problem. Faced with solving several such problems, the author utilized a spreadsheet (Lotus 1-2-3) to facilitate the problem solutions. In 1992 and 1993 few, if any, students had previous experience in utilizing a spreadsheet for engineering calculations. This solution method was presented to the class, and students were encouraged, but not required, to use the technique. In recent years, solution of several problems by use of a spreadsheet has been mandatory for the class. Use of the graphing capabilities of the spreadsheet, such as preparation of break-even plots, is also required.
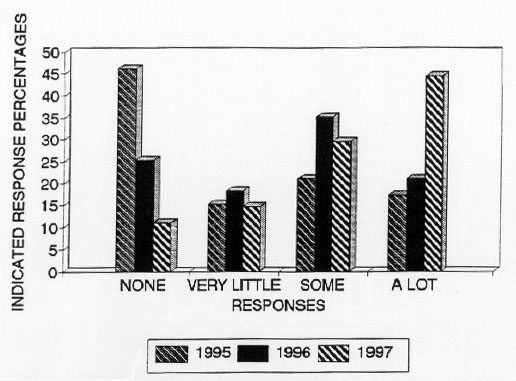
Student capability evaluation During the past three years, student capabilities in use of a spreadsheet were evaluated through a questionnaire distributed during the first week of classes each semester. This helped determine the appropriate time to spend on teaching the basics of spreadsheet operation. Summary results of the questionnaire are given in Figure 1. Note the steady increase in student capabilities that has occurred. This increase is the combined result of increased exposure to microcomputer capabilities that has occurred in the student's pre-college years, as well as through courses taken at Community Colleges or at SIUC. Two years ago an introductory required course, ME110, was first taught. As mentioned previously, this course includes instruction in spreadsheet use. Together with similar ones being implemented by other engineering departments, these courses should assure that essentially all students taking Engineering Economics in the future will have a basic capability in application of a spreadsheet to problem solving.
Figures 2 - 7 show the changes in student capabilities over the 1995 -97 period in use of the major spreadsheet software available; Lotus 1-2-3, Quatro-Pro, Excel, and Works. Figures 2-4 present the survey results of those students indicating they had "some" experience with spreadsheets. Comparison of these figures shows a decided trend away from Lotus 1-2-3 and Works to Excel, in terms of student capabilities. Quatro Pro capabilities have remained reasonably constant for this group.
Figures 5 - 7 present the survey results of those students indicating that they had "a lot" of experience with spreadsheets, over the 1995-97 period. comparison of these figures show a trend similar to that of the "some experience" group, in terms of a shift from Lotus 1-2-3 to Excel over the three year period, but not as pronounced. Lotus 1-2-3 and/or Quattro Pro amounted to 45 % of the responses in this group, compared to 55% for Excel. With the mixed student capabilities that exist it is desirable, to the extent feasible, to allow the students to choose whichever software they wish for working problems assigned.
Examples of spreadsheet applications One aspect of spreadsheet use that nearly all students taking the Engineering Economics course had not yet utilized is the "Range Name" capability, that permits designation of a cell (or group of cells) by an assigned name, rather than by a row/column address. In creation of a spreadsheet useful for economic analyses, this capability is essential. The initial assignment given to the students includes detailed instructions for entering the twelve basic equations utilized in time value of money calculations. This assignment has been made after completion of the initial few chapters in the text, that introduce these factors and their application in economic analyses. Figure 8 presents the resulting spreadsheet, where the cells containing the equations are given the common names for the various factors; P/F, F/P, A/F, etc.. The spreadsheet used was Lotus 1-2-3; it is nearly fully compatible with Quatro-Pro. Slight modifications in the range names are necessary for Excel, which does not accept some characters (/, <, =, >) in the range name.
The value of interest rate (I) number of compounding periods (N), and geometric gradient (r) are picked up from addresses assigned in the region below the factor calculations, which is a convenient location on the spreadsheet to work the problems. Figure 9 illustrates the solution of a trivial rate of return problem, utilizing the spreadsheet for an iterative solution to arrive at the rate of return. Thus, it is only necessary to enter the appropriate values of I, N, and r (if a geometric gradient is involved), and all factors are recalculated based on these values. The correct equation was written in text format to allow easy proof reading of the entry, then copied to the cell below and the text characters (everything to the left of and including the first equal sign, and the = 0 at the right side of the equation,) deleted. In Excel, the introductory equal sign is retained. The students are encouraged to use this approach in all their spreadsheet work, to facilitate proof reading the equation entries.
To permit use on problems that may have more than one combination of I, N, and r, the spreadsheet region shown in Figure 8 is copied to the right. It is necessary to assign appropriate range names (F/P2, P/F2, F/A2....) and to provide correct addresses for the second combinations of I, N, and r. This procedure is repeated, creating as many sets of factors as might be used; six has proven to be adequate. Calculation of equivalent interest rates, required when compounding periods vary, is readily introduced. Should students have errors on this initial assignment, it is returned (as many times as necessary) until it is correct, the incentive being raising the original grade to a 9.5/10 when it is correct. This is essential, since this spreadsheet is then used for subsequent assignments.
An example of another typical problem solution is given in Figure 10. That problem statement gave initial investment, annual operation and maintenance costs, annual O&M gradient, and salvage value for three alternative lighting improvements. The improved lighting is in response to an OSHA requirement, so the "do nothing " option does not exist. The alternatives are stated in increasing order of capital investment. The approach indicated is a present worth analysis. The net present worth equation is written for the first alternative, and then copied over the columns for the other alternatives. The $ entered before the factor names prevents those cell locations from being altered during the copying process. In this problem, the rates of return are not approriate, so are not calculated. The solution of the required incremental rates of return is accomplished by assuming a value for the incremental rate of return, entering the value, and observing the calculated amount for net present worth. When this approaches zero, the incremental rate of return (IROR) is correct; several iterations are usually required. The IROR and net present worth are recorded on the indicated rows, and calculation proceeds to the next column. The incremental rates of return are then utilized in the subsequent steps for solution of the problem. Although modern versions of spreadsheets permit solution without performing the iterative process, in this introductory economics course the few additional moment required by the "trial and error" approach provides the student with an appreciation of the sensitivity of the equation to the value of the interest rate or IROR.
SPREADSHEET APPLICATIONS IN THERMODYNAMICS
Introductory thermodynamics course The introductory thermodynamics course (ENGR300) typically includes an introduction to the technique of determining enthalpy change of a given compound or mixture of compounds through integration of the appropriate specific heat equations as a function of temperature. The equation form is usually as a power series, where the constants in the equation have been evaluated experimentally (Moran and Shapiro, 1992). It is a simple, but somewhat tedious matter to evaluate the integral of these expressions between the temperature limits required for solution of a given problem. If the values of the constants are entered on a spreadsheet, and the integrated form of the equation is also entered, it is a simple matter to generate the value of integral Cpdt for a given compound over the stated temperature limits. It is appropriate to have the students type in the constant values as given in the text (Figure 11). Once the equations and constants are entered on a spreadsheet, several problems may be assigned where utilization of integral Cpdt is required. Figure 12 presents the enthalpy change that occurs for several common gasses over the temperature range of 400K to 900K. Enthalpy changes between any two stated temperatures are calculated by the spreadsheet. Without the availability of the spreadsheet, few problems would probably be assigned, because of the lengthy calculations required.
Second thermodynamics course The second thermodynamics course (ME301) includes the calculation of the adiabatic flame temperature of a given fuel. This can be a very tedious task, since solution of the appropriate energy balance equation must be performed utilizing the standard heats of formation and the integral of Cp dt for each component on the reactant side and product sides of the balanced combustion equation. Through utilization of the spreadsheet that was developed in the introductory thermodynamics course, solution of the adiabatic flame temperature of a given fuel mixture is facilitated. Should some students not have a disk containing the Cp data, that is provided to the student in a subdirectory created for the course, entered on the hard drive of computers that are readily available to the students. The integrated specific heat equations and constants from the Van Wylen text (Van Wylen and Sonntag, 1976) are also placed in a file in the subdirectory. An assignment is made to compare the enthalpy change observed using the Moran and Shapiro and the Van Wylen equations over an arbitrary temperature range. This assignment provides reasonable assurance that the Van Wylen equations, which apply over the higher temperature ranges appropriate to flame temperature calculations, have been correctly entered. Thus the student proceeds with confidence to apply the energy balance equations required for calculation of the adiabatic flame temperature.
As in the case of the Economics course, range names are used in calculation of the enthalpy change for a given component. Thermodynamic values for standard heats of formation of the usual gaseous components of combustion are entered elsewhere on the spreadsheet, and each value given a name. The enthalpy changes for the compounds involved in the balanced combustion equation are calculated utilizing the spreadsheet constructed in the introductory thermodynamics course. The enthalpy changes for carbon dioxide is designated as DHCO2, that of nitrogen as DHN2, and so on. Standard heats of formation for the reactants and products are named HFCH4 (for methane), and so on. The energy balance equation is then written in terms of the heats of formation and enthalpy changes for the involved compounds, utilizing the range names. An iterative procedure is then carried out, where the adiabatic flame temperature is estimated and the energy balance equation results are observed. The correct adiabatic flame temperature is determined when the energy balance approaches zero.
Hazardous waste incineration course The content of a senior level/graduate level course in hazardous waste incineration (ME419) includes calculation procedures for incineration of various hazardous materials. The calculation procedure is a logical extension of the adiabatic flame temperature calculation procedure developed in the second thermodynamics course. One of the major design constraints in incineration of hazardous materials includes maintaining a given minimum temperature for a given minimum time. To illustrate the design procedures required, various waste streams are considered. Wastes incinerated include medical wastes, and soil contaminated with hazardous materials, such as PCB's.
The additions to the worksheet developed in the first and second thermodynamics courses require a balanced combustion equation for the waste material, and Cp data for the inert materials, such as soil. Additional useful additions to the spreadsheet include calculation of flow rates and residence times of combustion products given dimensional information of the exhaust ductwork and stack.
During spring semester 1996, construction of a portable incinerator to burn PCB contaminated soil at Crab Orchard National Wildlife Refuge, about 20 miles from the SIUC campus, was completed. The incinerator operation is scheduled to burn 95,000 tons of contaminated soil; approximately 80,000 tons have been burned at the time this paper was prepared. Extensive documentation (floor to ceiling shelves, about 6 ft wide) on the studies leading to determination of the problem, environmental dangers and alternative correction measures, and detailed permit applications for the construction and operation of the incinerator were available at the SIUC library. Utilizing this documentation, students were assigned to review various documents, and to summarize these in oral presentations to the class. A tour of the facilities was arranged for the class, following which problems were assigned related to design and operation of the incinerator. Based on energy and material balance information from the documentation, "real" numbers were used in the problems assigned. One requirement was to predict the maximum feed rate permissible for different moisture contents of the feed soils. This application of spreadsheet calculations illustrates how specific spreadsheet capabilities obtained by the student in junior level courses may be integrated to senior/graduate level courses. A natural extension would be to include the engineering economics spreadsheet with the one developed in the hazardous waste incineration course.
CONCLUSIONS
Although the examples give above could be programmed in FORTRAN or some other computer language, it is far easier for the student to grasp the basic principles and techniques involved in an integrated design project through use of a spreadsheet. The two subject areas chosen for this paper illustrate how the spreadsheet can serve as a framework to integrate subject matter and student capabilities through the engineering curriculum. Many such opportunities exist in the engineering curriculum; we simply need to identify them and implement them. The net result should be a more effective engineering program, that better prepares students for their professional practice. The approach should also be suitable for distance learning situations.
REFERENCES
Figure 1. Results of questionnaire on student spreadsheet capabilities, engineering econimics classes spring semesters, 1995, 1996, 1997. up
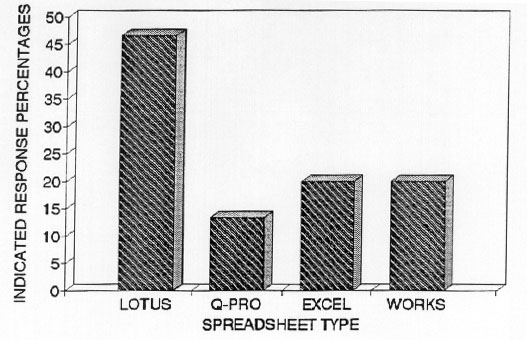
Figure 2. Results of questionnaire on student spreadsheet capabilities, engineering econimics class spring semesteer, 1995. Knowledge of indicated software, for those students indicating some capability. up
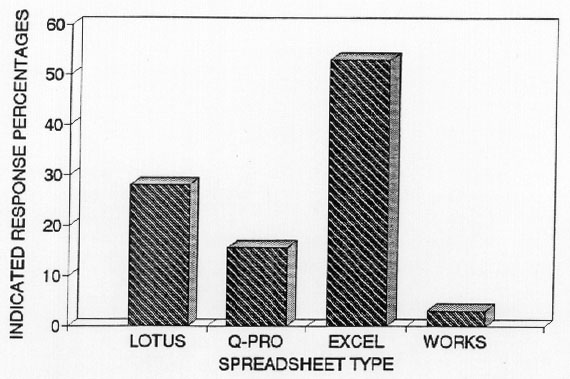
Figure 3. Results of questionnaire on student spreadsheet capabilities, engineering economics class spring semester, 1996. Knowledge of indicated software, for those students indicating some capability. up
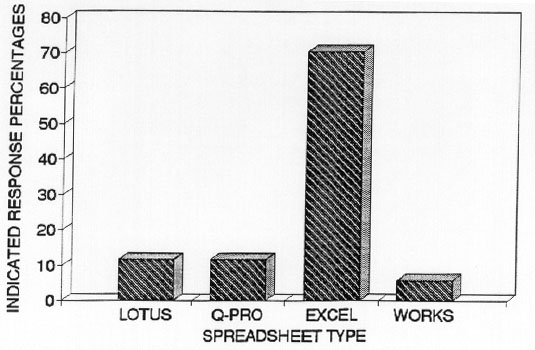
Figure 4. Results of questionnaire on student spreadsheet capabilities, engineering economics class spring semester, 1997. Knowledge of indicated software, for those students indicating some capability. up
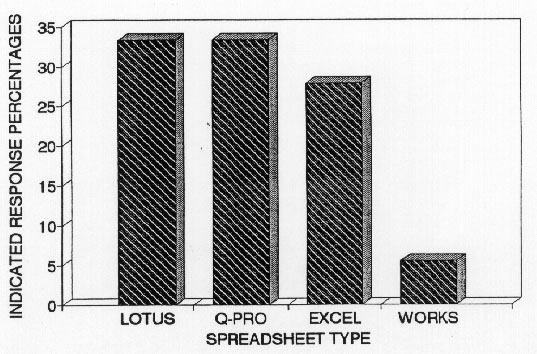
Figure 5. Results of questionnaire on student spreadsheet capabilities, engineering economics class spring semester, 1995. Knowledge of indicated software, for those students indicating a lot of capability. up
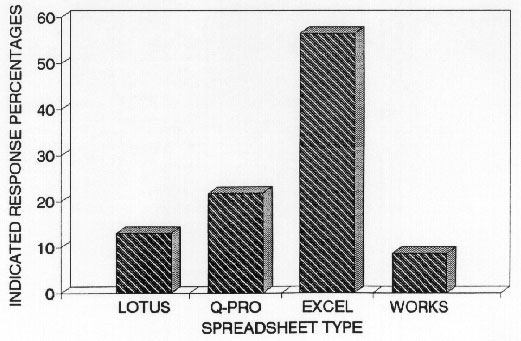
Figure 6. Results of questionnaire on student spreadsheet capabilities, engineering economics class spring semester, 1996. Knowledge of indicated software, for those students indicating a lot of capability. up
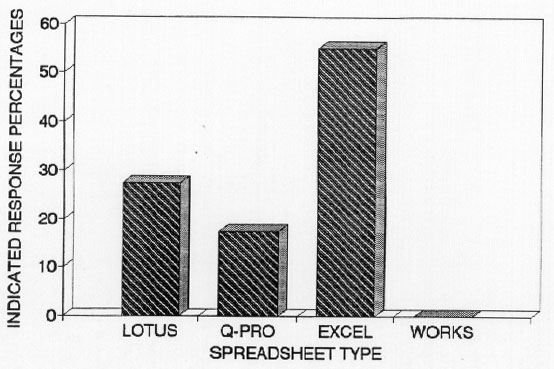
Figure 7. Results of questionnaire on student spreadsheet capabilities, engineering economics class spring semester, 1997. Knowledge of indicated software, for those students indicating a lot of capability. up
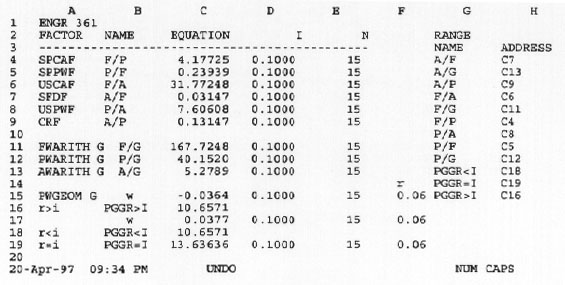
Figure 8. Initial spreadsheet assignment for engineering economics class. up
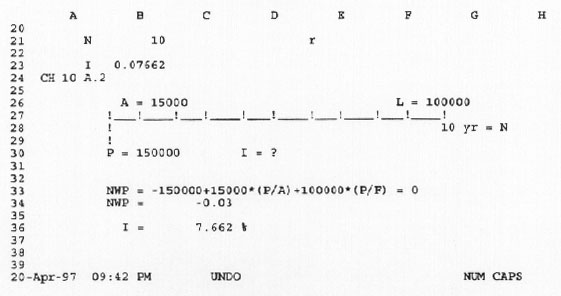
Figure 9. Elementary rate of return problem, illustrating use of the spreadsheet. Given an investment of $150,000, annual income of $15,000, and a salvage value of $100,000 after 10 years, determine rate of return. up
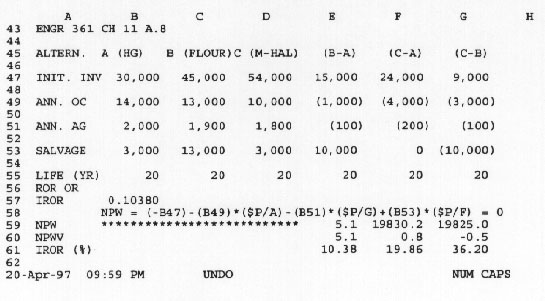
Figure 10. An incremental rate of return problem. Given that new lighting must be installed in a factory, determine which lighting system (HG), (FLOUR), or (M-HALIDE) should be recommended, based on incremental rate of return analysis. Initial investment, annual operating cost and associated annual gradient, salvage value and lives are as indicated. up
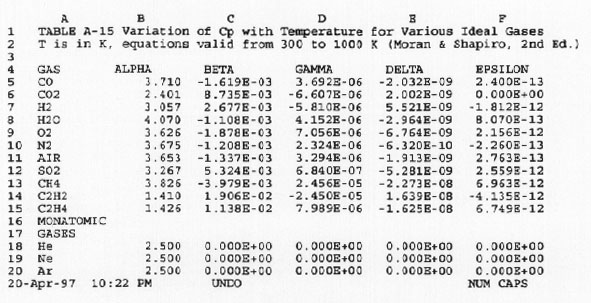
Figure 11. Constants for calculating specific heat at constant pressure (Moran & Shapiro, 1992). up
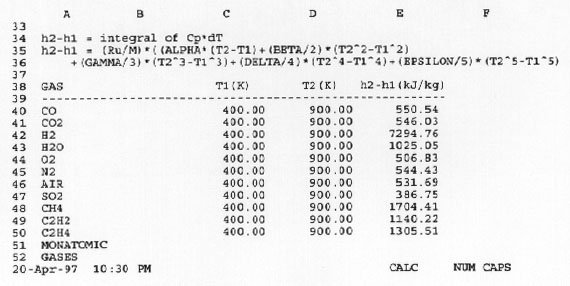
Figure 12. Enthalpy change of some common gases over a temperature increase from 400K to 900K. up
 Back to Table of
Contents
Back to Table of
Contents